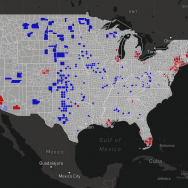
Citizens and voters can now track their congressional districts alongside the coronavirus pandemic, thanks to a new tool from the University of Chicago’s Center for Spatial Data Science.
Launched earlier this year, the COVID Atlas interactive visualization compiles county-level case numbers, generates daily hotspot statistics, and displays them on an easy-to-read map. Now, the online resource also includes a congressional district overlay—a new feature that allows users to see how the impacts of COVID-19 might differ according to local government responses.
“Because there’s been no federal, coordinated response, we’re seeing that the context of hotspots is dependent on the patchwork of local policies that has emerged,” said Marynia Kolak, who co-leads the Atlas as the assistant director of health informatics at the Center for Spatial Data Science. “Since all politics are local—and COVID-19 is a very local experience—it seemed responsible to add congressional districts.
“Obviously, the coronavirus is a complicated and multidimensional disease. But as the pandemic progresses, it’s also true that policy is part of that, so we thought we should add this piece of information to support people’s decision-making.”
Kolak’s previous work included analyzing the spread of the opioid epidemic, where she found local data and meaningful statistics to be crucial. As the coronavirus began to spread rapidly, she and colleagues at the Center for Spatial Data Science quickly applied the approach to better identify and track COVID-19 hotspots on a daily basis. Early in the pandemic, they called attention to rural hot-spots that were overlooked in state-level data. The team also linked over a dozen community health factors and highlighted regions of excess risk, like hypersegregated cities and the Black Belt.
As time passes, she said, more narratives emerge.
“For example, the Great Plains are being really hard hit right now, but those hotspots started a long time ago—weeks,” Kolak said. “We’ve watched and seen that once it starts to spread across multiple counties, it becomes really difficult to control. So one lesson from the Plains spread is trying to contain before it that happens.”
In rural areas, there are fewer hospitals and fewer ventilators, so spread becomes deadly more easily, she added: “It’s a reminder not to look at just the [case] numbers themselves, because they don’t tell the full story.”
To learn more, visit the interactive COVID Atlas online.
